Monday, July 30, 2012

Biomass as an organic renewable energy source


The U.S. Department of Energy has just released this video to educate people on the research, industry and government’s efforts to develop biomass as an organic renewable energy source; employing agriculture and forest residues, energy crops, and algae to take the place of conventional fuels like gasoline, diesel, and jet fuel. CCRES Algae Team

Saturday, July 28, 2012

London is going for the green


Croatian Center of Renewable Energy Sources (CCRES)
and


 shares to you forward to a friend

London 2012: Going
for the Green

The London games will leave a legacy as the most energy efficient Olympics to date. Learn about how the London 2012 Olympics is cutting down the watts and water to keep the games energy efficient.

With sustainable and recyclable facilities, London is going for the green.    
2012 Olympics


Energy 101 | Biofuels

Energy 101 | Biofuels
Learn the basics of biofuels technology by watching the latest in our Energy 101 video series.


Dr. Richter Meets with President Obama

Q&A with Nobel Laureate Burton Richter
Burton Richter recently received the prestigious Enrico Fermi Award for his work in particle physics. In 1976, he received a Nobel Prize in Physics for discovering a new type of subatomic particle.
Clean Energy in My Community
Clean Energy In My Community
The first in a new Energy.gov video series about local clean energy projects is Luther College and its partnership with the town of Decorah, Iowa.


Thursday, July 26, 2012

PRAVILNIK O IZMJENAMA I DOPUNAMA PRAVILNIKA O JEDNOSTAVNIM GRAĐEVINAMA I RADOVIMA


Hrvatski Centar Obnovljivih Izvora Energije (HCOIE)
prenosi Vam 

PRAVILNIK
O IZMJENAMA I DOPUNAMA PRAVILNIKA O JEDNOSTAVNIM GRAĐEVINAMA I RADOVIMA
Članak 1.
U Pravilniku o jednostavnim građevinama i radovima (»Narodne novine«, br. 21/09, 57/10, 126/10 i 48/11) u članku 1. iza riječi: »jednostavne« dodaju se riječi: »i druge«.
Članak 2.
Članak 2. mijenja se i glasi:
»Bez akta kojim se odobrava građenje i lokacijske dozvole, a u skladu s glavnim projektom ili tipskim projektom za kojega je doneseno rješenje na temelju članka 196. Zakona o prostornom uređenju i gradnji, može se graditi:
1. Pomoćna građevina koja se gradi na građevnoj čestici postojeće zgrade za potrebe te zgrade i to:
– cisterna za vodu i septička jama zapremine do 27 m³,
– podzemni i nadzemni spremnik goriva zapremine do 10 m³,
– bazen tlocrtne površine do 24 m² i dubine do 2 m,
– sustav sunčanih kolektora, odnosno fotonaponskih modula u svrhu proizvodnje toplinske, odnosno električne energije;
2. Priključak kojim se postojeća građevina priključuje na infrastrukturne instalacije (niskonaponsku električnu i telekomunikacijsku mrežu, vodovod, kanalizaciju, plinovod, toplovod, kabelsku televiziju);
3. Dječje igralište;
4. Građevina namijenjena:
– mjerenju kakvoće zraka, radioloških, meteoroloških i aerosolnih veličina, vodostaja rijeke ili drugim mjerenjima prema posebnom zakonu,
– istražnim mjerenjima na temelju odluke tijela nadležnog za ta istražna mjerenja;
5. Građevina protugradne obrane;
6. Građevina za sigurnost:
– cestovnog prometa (vertikalna i horizontalna signalizacija),
– plovidbe (objekt signalizacije),
– zračnog prometa (objekata za smještaj navigacijskog uređaja građevinske (bruto) površine do 12 m²);
7. Prenosiva autoplin jedinice (tzv. »skid« jedinica) zapremine do 10 m³ na građevnoj čestici postojeće benzinske postaje;
8. Privremena građevine za potrebe građenja građevine odnosno uređenja gradilišta kada se izvode unutar građevne čestice odnosno obuhvata zahvata u prostoru određenog lokacijskom dozvolom, osim asfaltne baze, separacije agregata, tvornice betona, dalekovoda i transformatorske stanice radi napajanja gradilišta električnom energijom te prijenosnog spremnika za smještaj, čuvanje ili držanje eksplozivnih tvari osim nadzemnog i podzemnog spremnika ukapljenoga naftnog plina, odnosno nafte zapremine do 10 m³;
9. građevina unutar pružnog pojasa željezničke pruge, namijenjena osiguravanju željezničko-cestovnog prijelaza i to:
– građevina za smještaj unutrašnje opreme, građevinske (bruto) površine do 6 m² i visine do 3,2 m mjereno od najnižeg dijela konačno zaravnanog i uređenog terena uz pročelje do najviše točke građevine,
– vanjski elementi osiguranja prijelaza (svjetlosni znakovi za označivanje prijelaza ceste preko željezničke pruge dodatno opremljeni s jakozvučnim zvonima, branici ili polubranici s uključno/isključnim elementi na tračnicama),
– kabel za međusobno povezivanje unutrašnje opreme u kućici i vanjskih elemenata unutar jednog prijelaza;
10. Građevina namijenjena gospodarenju šumom u skladu s posebnim propisom, kao što je:
– šumska cesta u šumi ili na šumskom zemljištu širine do 5 m, izvedena na tlu bez završnog zastora (makadam ili zemljani put)
– pješačka staze,
– šumski protupožarni prosjek;
11. Građevina i oprema namijenjene biljnoj proizvodnji na otvorenom prostoru, kao što je:
– hidrantski priključak za navodnjavanje i protumraznu zaštitu, razvod sustava za navodnjavanje i protumraznu zaštitu od hidrantskog priključka ili razvod na parceli krajnjeg korisnika,
– zacijevljeni bunar promjera manjeg ili jednakog 100 cm, za potrebe prihvata vode za navodnjavanje i druge aktivnosti poljoprivredne proizvodnje,
– kanal za sakupljanje oborinskih i erozivnih voda izveden neposredno u tlu i sa zaštitom od procjeđivanja izvedenom isključivo od fleksibilnih folija,
– akumulacija za navodnjavanje sa zaštitom od procjeđivanja isključivo fleksibilnom folijom,
– poljski put na poljoprivrednoj površini širine manje ili jednake 5 m, izveden u tlu bez završnog zastora (makadam ili zemljani put);
12. Građevina i oprema namijenjena biljnoj proizvodnji u zatvorenom prostoru, kao što je:
– plastenik s pokrovom mase plohe pokrova manje ili jednake 1,5 kg/m² izrađenim od polimerne folije odnosno od polikarbonatnih i/ili poliesterskih ploča i potkonstrukcijom s trakastim temeljima ili temeljima samcima, bez izvedenog poda i bez stacionarnih uređaja za grijanje i ostalih instalacija,
– staklenik s pokrovom najveće mase plohe pokrova manje ili jednake 12,5 kg/m² i potkonstrukcijom s trakastim temeljima ili temeljima samcima, bez izvedenog poda i bez stacionarnih uređaja za grijanje i ostalih instalacija,
– plastenik, odnosno staklenik iz alineje 1. i 2. ovoga podstavka s razvodom sustava za navodnjavanje, toplovodnog ili toplozračnog grijanja, niskonaponske električne instalacije te instalacije plina, uključivo priključak na postojeću građevinu za opskrbu vodom, plinom i električnom energijom, pripremu tople vode ili toplog zraka, pripremu mješavine hranjive otopine ili skladištenje CO2;
13. Građevina i oprema namijenjena držanju stoke, kao što je:
– vjetrenjača s bunarom i pumpom za crpljenje vode namijenjena parceli jednog korisnika,
– sabirališta mlijeka s pristupnim putem širine manje ili jednake 5 m, izveden u tlu bez završnog zastora (makadam ili zemljani put);
14. Građevina seizmološke postaje Seizmološke službe Republike Hrvatske;
15. Antenski stup elektroničke komunikacijske infrastrukture mobilnog operatera sa baznom stanicom;
16. Zamjenski informacijski stup oglasne površine veće od 12 m².
Bez akta kojim se odobrava građenje i lokacijske dozvole te bez glavnog projekta, može se graditi:
1. Vrtna sjenica i nadstrešnica tlocrtne površine do 15 m² na građevnoj čestici postojeće zgrade;
2. Ograda visine do 1,6 m i potporni zid visine do 1 m, mjereno od najnižeg dijela konačno zaravnanog i uređenog terena uz ogradu odnosno zid do najviše točke ograde odnosno zida;
3. Građevina na javnoj površini koja se gradi u skladu s odlukom nadležnog tijela jedinice lokalne samouprave prema propisima kojima se uređuje komunalno gospodarstvo i to:
– kiosk i druga građevina gotove konstrukcije građevinske (bruto) površine do 12 m²,
– nadstrešnica za sklanjanje ljudi u javnom prometu,
– spomeničko ili sakralno obilježje građevinske (bruto) površine do 12 m² i visine do 4 m od razine okolnog tla,
– reklamni pano oglasne površine do 12 m²,
– komunalna oprema (klupa, koš za otpatke, tenda, jednostavni podesti otvorenih terasa i sl.);
4. Grobnica i spomenik na groblju;
5. Privremena građevine za potrebe sajmova i javnih manifestacija s najdužim rokom trajanja do 90 dana;
6. Pješačka staza, promatračnica, obavijesna ploče površine do 12 m² i druga oprema zaštićenih dijelova prirode prema odluci javnih ustanova koje upravljaju tim zaštićenim dijelovima prirode;
7. Građevina i oprema namijenjene biljnoj proizvodnji na otvorenom prostoru, kao što je oprema za dugogodišnje nasade (vinograde, voćnjake, hmeljike, maslinike) i rasadnike ukrasnog bilja te voćnog i vinogradarskog sadnog materijala, što uključuje konstrukciju nasada bez obzira na materijal (stupovi, zatega, žice, podupore) ovisno o uzgojnom obliku, protugradnu mrežu s potkonstrukcijom i ograđivanje poljoprivrednih površina prozračnom ogradom sa stupovima bez trakastog temeljenja;
8. Građevina i oprema namijenjena biljnoj proizvodnji u zatvorenom prostoru, kao što je niski i visoki poljoprivredni tunel s tunelskim pokrovom koji nije krut (plastična folija i sl.) i potkonstrukcijom koja se ne temelji, najveće visine tunela manje ili jednake 2,5 m i širine tunela manje ili jednake 6 m;
9. Građevina i oprema namijenjena držanju stoke, kao što je:
– ograda za pregrađivanje i ograđivanje pašnjaka i prostora za držanje stoke, divljači i zaštićenih životinjskih vrsta na otvorenom, uključivo ogradu pod naponom struje 24 V (električni pastir),
– nadstrešnica za sklanjanje stoke s prostorom zaklonjenim od vjetra zatvorenim s najviše tri strane,
– pojilo za stoku,
– konstrukcija za držanje košnica pčela;
10. Čeka, hranilište, solište, mrcilište i gatar koji se grade u lovištu;
11. Ugljenara izvan građevinskog područja do 4 m promjera i do 4 m visine.«.
Članak 3.
Članak 3. mijenja se i glasi:
»Bez akta kojim se odobrava građenje i lokacijske dozvole, a u skladu s glavnim projektom ili tipskim projektom za kojega je doneseno rješenje na temelju članka 196. Zakona o prostornom uređenju i gradnji, mogu se izvoditi radovi na:
1. Vodotoku i vodnom dobru, javnoj cesti, građevini željezničke infrastrukture, unutarnjem plovnom putu i drugim građevinama, koji su prema posebnom propisu nužni za ispunjavanje obveza tehničkog i gospodarskog održavanja ako tim radovima ne nastaje nova građevina niti se mijenjaju lokacijski uvjeti;
2. Postojećoj građevini kojim se postavlja elektronička komunikacijska oprema (antenski prihvat);
3. Postojećoj građevini kojim se proširuje kapacitet glavnog razdjelnika nepokretne javne telefonske mreže na način da se s vanjske strane građevine prigrade najviše 3 ormarića oslonjena na tlo maksimalnih vanjskih gabarita 0,60 x 2 x 2 m, pod uvjetom da su ormarići smješteni na građevnoj čestici građevine;
4. Postojećoj zgradi kojim se dodaju, obnavljaju ili zamjenjuju dijelovi zgrade koji su dio omotača grijanog ili hlađenog dijela zgrade ili su dio tehničkog sustava zgrade, kao što su:
– prozori, vrata ili prozirni elementi pročelja,
– toplinska izolacija podova, zidova, stropova, ravnih i kosih krovova,
– hidroizolacija,
– oprema, odnosno postrojenje za grijanje, hlađenje ili ventilaciju, te za automatsko upravljanje, regulaciju i daljinsko praćenje potrošnje energije ili vode,
– vodovod i kanalizacija,
– plinske instalacije;
5. Postojećoj zgradi kojim se postojeći sustav grijanja i zagrijavanja potrošne tople vode zamjenjuje sustavom koji je riješen iskorištavanjem toplinske energije tla primjenom dizalica topline čiji podzemni izmjenjivači topline ne prelaze na susjedne čestice;
6. Postojećoj zgradi kojim se postavlja sustav sunčanih kolektora, odnosno fotonaponskih modula u svrhu proizvodnje toplinske, odnosno električne energije;
7. Postojećim instalacijama javne rasvjete u svrhu poboljšanja njihove energetske učinkovitosti;
8. Postojećoj građevini kojim se postavlja oprema namijenjena punjenju elektromotornih vozila.
Bez akta kojim se odobrava građenje i lokacijske dozvole te bez glavnog projekta, mogu se izvoditi radovi na:
1. Postojećoj građevini kojima se ne mijenja usklađenost građevine s lokacijskim uvjetima u skladu s kojima je izgrađena niti se utječe na ispunjavanje bitnih zahtjeva za građevinu;
2. Uređenju građevne čestice postojeće građevine kao što je građenje staze, platoa i stuba oslonjenih cijelom površinom neposredno na tlo s pripadajućim rukohvatima, vrtnog bazena ili ribnjaka građevinske (bruto) površine do 12 m² i dubine do 1 m od razine okolnog tla, otvorenog ognjišta građevinske (bruto) površine do 1,5 m² i visine do 3 m od razine okolnog tla, stabilnih dječjih igračaka;
3. Stubama, hodnicima i drugim prostorima na pristupima građevini i unutar građevine, te na javnim površinama radi omogućavanja nesmetanog pristupa i kretanja osobama s teškoćama u kretanju ako se time ne narušava funkcija i namjena građevine, odnosno ako se ne utječe na ispunjavanje bitnih zahtjeva za građevinu i /ili zadovoljavanje lokacijskih uvjeta, te druge radove denivelacije, ugradbe zvučnih semaforskih uređaja i ugradbe taktilnih površina u građevinama i na javno-prometnim površinama.«.
Članak 4.
U članku 4. stavku 1. podstavku 2. riječ: »ne« briše se.
Članak 5.
Članak 4.a mijenja se i glasi:
»Bez rješenja o uvjetima građenja, a u skladu s glavnim projektom, može se pristupiti rekonstrukciji zgrade kojom se ne mijenjaju lokacijski uvjeti u skladu s kojima je ista izgrađena.«.
Članak 6.
Ovaj Pravilnik stupa na snagu osmog dana od dana objave u »Narodnim novinama«.
Klasa: 360-01/12-04/10
Urbroj: 531-01-12-1
Zagreb, 13. srpnja 2012.

Na temelju članka 104. i članka 209. stavka 5. Zakona o prostornom uređenju i gradnji (»Narodne novine«, br. 76/07, 38/09, 55/11, 90/11 i 50/12) ministar graditeljstva i prostornoga uređenja
Ministar
Ivan Vrdoljak, dipl. ing. el., v. r.

Hrvatski Centar Obnovljivih Izvora Energije (HCOIE)

News and Events by CCRES July 26, 2012


Croatian Center of Renewable Energy Sources 

News and Events July 26, 2012

Energy Department Investments to Advance Hydrogen Infrastructure

Photo of man fueling a car which has a metal storage tank in the trunk.
The Energy Department is supporting the collection and analysis of performance data for hydrogen fueling stations and advanced refueling components.
Credit: Lawrence Livermore National Laboratory
The Energy Department on July 18 announced a $2.4 million investment to collect and analyze performance data for hydrogen fueling stations and advanced refueling components. The five projects—located in California, Connecticut, and Illinois—will track the performance and technical progress of innovative refueling systems at planned or existing hydrogen fueling stations in order to find ways to lower costs and improve operation. These investments are part of the department's commitment to support U.S. leadership in advanced hydrogen and fuel cell research and to help related industries bring hydrogen technologies into the marketplace at lower cost.
As part of a two-year initiative, the Energy Department will make $2.4 million available in fiscal year 2012, with a 50% cost share provided by the award winners. The projects selected for negotiation of award include: California Air Resources Board, which will analyze an operating hydrogen refueling station that uses natural gas to produce hydrogen; California State University and Los Angeles Auxiliary Services, Inc., which will collect data from hydrogen refueling architecture deployed at California State University - Los Angeles; Gas Technology Institute in Des Plaines, Illinois, which will analyze data from five hydrogen fueling stations; and Proton Energy Systems in Wallingford, Connecticut, which will conduct two projects providing operational data from two existing stations that integrate hydrogen generation, compression, storage, and dispensing, as well as deploying an advanced high-pressure electrolyzer at an existing hydrogen fueling station.
These new projects will collect data and monitor the performance of hydrogen fuel stations, advanced components, and other innovative hydrogen technologies using renewable energy or natural gas. By analyzing performance in real-world environments, these projects will help hydrogen fueling equipment manufacturers improve the designs of existing systems. The aim is to achieve higher efficiencies and test new system components. This data will help focus future research and development efforts, driving American manufacturing competitiveness in the next generation of hydrogen and fuel cell technologies.
In addition, the Energy Department recently released the final report from its National Renewable Energy Laboratory (NREL) about a technology validation project that collected data from more than 180 fuel cell electric vehicles (EVs). Over six years, these vehicles made more than 500,000 trips and traveled 3.6 million miles, completing more than 33,000 fill-ups at hydrogen fueling stations across the country. The project found that these vehicles achieved more than twice the efficiency of today's gasoline vehicles with refueling times of five minutes for four kilograms of hydrogen. See the DOE Progress Alert and the NREL final report on 180 fuel cell EVsPDF.


Energy Department Launches 2013 Better Buildings Federal Award

The Energy Department on July 20 began accepting nominations for its 2013 Better Buildings Federal Award (BBFA), which recognizes the federal government's highest-performing energy efficient buildings. The year-long competition challenges agencies to achieve the greatest reduction in annual energy intensity—or energy consumed per square foot—and honors the federal building that achieves the greatest energy savings at the end of the designated 12-month period. The nomination process for 2013 will be open through September 7, 2012, and the winner will be announced late next year. Meanwhile, the winner of the 2012 competition is scheduled to be announced later this year.
The department will select finalists for the competition based on energy efficiency measures deployed in the facilities, best practices in energy management undertaken by facility personnel, and institutional change programs used to encourage sustainability efforts within facilities. Once selected, the finalists will compete head-to-head to attain the greatest reduction in energy intensity over 2013. Finalists will represent a range of building types, sizes, and agency functions. The BBFA is part of the Obama Administration's Better Buildings Initiative, challenging the private and public sectors to make quick investments to improve energy efficiency in America's buildings by 20% over the next decade. See the DOE Progress Alert and the Federal Energy Management Program website.


Administration Maps Solar Energy Development on Public Lands

The U.S. Department of the Interior (DOI) announced on July 24 that in partnership with the Energy Department, it will publish the final Programmatic Environmental Impact Statement (PEIS) for solar energy development in six southwestern states—Arizona, California, Colorado, Nevada, New Mexico, and Utah. The final solar PEIS represents a major step forward in the permitting of utility-scale solar energy on public lands throughout the west.
The solar PEIS planning effort has focused on identifying locations on Bureau of Land Management (BLM) lands that are most suitable for solar energy development. The solar PEIS will serve as a roadmap for solar energy development by establishing solar energy zones, which have access to existing or planned transmission and minimal resource conflicts, and incentives for development within those zones. The blueprint’s comprehensive analysis will make for faster, better permitting of large-scale solar projects on public lands.
These areas are characterized by excellent solar resources, good energy transmission potential, and relatively low conflict with biological, cultural, and historic resources. The final PEIS identifies 17 Solar Energy Zones (SEZs), totaling about 285,000 acres of public lands, as priority areas for utility-scale solar development, with the potential for creating additional zones through ongoing and future regional planning processes. The blueprint also allows for utility-scale solar development on approximately 19 million acres in "variance" areas lying outside of identified SEZs. It also excludes 78 million acres from solar energy development to protect cultural or natural resources. In total, the final PEIS estimates that 23,700 megawatts could be developed from the 17 zones and the variance areas, enough renewable energy to power 7 million U.S. homes.
The July 27 Federal Register Notice of Availability for the Final PEIS will begin a 30-day protest period, after which DOI may consider adopting the document through a Record of Decision. The BLM released the draft solar PEIS in December 2010, and in response to the over 80,000 comments received from cooperating agencies and key stakeholders, issued a supplement to the draft solar PEIS in October 2011. See the Energy Department press release and the solar PEIS.


'Great Green Fleet' Tests Biofuels in Hawaii Exercise

Photo of two Navy ships sailing.
The U.S. Navy tested its "Great Green Fleet," a Carrier Strike Group's aircraft and surface ships, on advanced biofuel.
Credit: U.S. Navy
The U.S. Navy recently used advanced biofuel to power its "Great Green Fleet," a selection of aircraft and surface ships of the U.S. Navy’s Carrier Strike Group, to test the fuel's performance in an operational setting. The demonstration took place on July 17 and 18 off the coast of Hawaii as part of the Rim of the Pacific Exercise. The operation was the first ever using biofuels in an exercise of this scale. The biofuel blends are 50-50 mixtures of biofuel (made from used cooking oil and algae) and either petroleum-based marine diesel or aviation fuel. Approximately 450,000 gallons of 100% biofuel were purchased in 2011 in preparation for the Great Green Fleet demonstration.
During this operation, the Great Green Fleet also showcased energy efficiency technology that increase combat capability by allowing Navy ships to achieve greater range and reduction of dependence on a vulnerable logistics supply chain. Further, this demonstration included the following maritime efficiency measures: the use of light-emitting diodes (LEDs) to save energy, especially when replacing incandescent fixtures or in colored lighting applications; a ship energy dashboard which provides real-time situational awareness of energy demand associated with equipment; and a smart voyage planning decision aid, which sends messages to ships with optimized routing plans for both ship safety and fuel savings. The Navy signed a Statement of Cooperation with the Royal Australian Navy to formalize future cooperation on alternative fuel deployment.
The demonstration is a component of a broader administration effort to reduce reliance on imported petroleum by partnering with the private sector to speed the commercialization of next-generation biofuels. For example, in early July the Energy Department, the Navy, and the U.S. Department of Agriculture announced $30 million in funding to support commercialization of "drop-in" biofuel substitutes for diesel and jet fuel, and the Energy Department announced an additional $32 million to support research into advanced biofuel technologies that are in earlier stages of development. See the USDA press release , the Navy website, and the July 5 EERE Network News.


Guidelines Revised for U.S. Wave Energy, Ocean Current Technologies

The Bureau of Ocean Energy Management (BOEM) and the Federal Energy Regulatory Commission (FERC) on July 19 announced revised guidelines for developers pursuing technology testing and commercial development on the Outer Continental Shelf (OCS). The revisions further clarify the regulatory process and help streamline the process for authorizing research and testing of marine hydrokinetics—energy developed from waves and ocean currents.
The revised guidelines replace 2009 guidelines; they also provide information about agency responsibilities and how best to navigate the process for obtaining a marine hydrokinetic lease and license on the OCS. They cover topics such as provisions for obtaining leases and licenses, fee structures, and hybrid (e.g., wind and marine hydrokinetic) project considerations. The guidelines were developed as part of a Memorandum of Understanding between the Department of the Interior and FERC. Under the Memorandum, BOEM and FERC will coordinate to ensure that marine hydrokinetic projects address public interest, including the adequate protection of fish, wildlife, and marine resources and other beneficial public uses. See the BOEM press releasePDF and the complete guidelines PDF.
 

CROATIAN CENTER of RENEWABLE ENERGY SOURCES (CCRES)

  special thanks to U.S. Department of Energy | USA.gov

Greening Up the Sports World

How could 35 professional sports teams and 20 million square feet of sports facilities improve their energy efficiency and be more environmentally friendly?
That's the question the Energy Department is answering through its Better Buildings Challenge. In order to illustrate the Department’s strategy for greening professional sports facilities, we are highlighting several green sports initiatives aiming to change the way our nation does athletics.
At a recent White House event, the Obama Administration celebrated the sports industry's successes in saving energy, reducing waste, and adopting sustainable practices at sports facilities as part of the Challenge. President Obama established the Better Buildings Challenge to encourage major corporations, universities, and state and local governments to lead the way in saving energy and money and to showcase the best energy-saving results and strategies. Better Buildings has teamed up with the Green Sports Alliance, an organization whose mission is to help sports teams, venues, and leagues be more environmentally friendly. To read the complete story, see the Energy Blog.

Croatian Center of Renewable Energy Sources (CCRES)

Saturday, July 21, 2012

2012 The World's 10 Biggest Oil Companies


2012 The World's 10 Biggest Oil Companies


1. Saudi Aramco - 12.5 million barrels per day

Saudi Aramco is by far the biggest energy company in the world, generating more than $1 billion a day in revenues. This image depicts the Shaybah mega-project, sitting on more than 15 billion barrels of oil in the Rub al-Khali desert. Aramco's biggest field, Ghawar, can do 5 million bpd.

2. Gazprom - 9.7 million barrels per day

Russia's Gazprom is the world's largest producer of natural gas. Controlled by the Kremlin, Gazprom's monopoly on gas deliveries to much of Europe provides President Vladimir Putin a prime lever for projecting power in the region. Gazprom's profits are more than $40 billion a year.

3. National Iranian Oil Co. - 6.4 million barrels per day

Iran has been forced to curtail oil production due to international sanctions, but remains a huge oil and gas producer. To skirt sanctions, Turkey and India have reportedly been paying for Iranian oil with gold. The Strait of Hormuz remains the world's most significant choke point for oil. Iran has threatened to close the Strait if attacked.

4. ExxonMobil - 5.3 million barrels per day

Exxon's $40 billion in annual profits don't seem like a lot when you consider their $400 billion in sales. It takes giant projects to "move the needle" for the Big Unit. That means CEO Rex Tillerson has to make friends with potentates. In this picture from last April, Tillerson is meeting with Russia's Vladimir Putin to iron out a joint venture between Exxon and Russia's state-controlled oil giant Rosneft.

5. PetroChina - 4.4 million barrels per day

The largest of China's three state-controlled oil giants, PetroChina also has the highest market cap of any of the publicly traded giants. The company already produces more oil than ExxonMobil, and considering the estimates of massive shale gas under China, could someday vie with Gazprom as a regional gas power.


6. BP - 4.1 million barrels per day

Bob Dudley is seeking to turn the giant formerly known as British Petroleum around. Selling assets, settling lawsuits, promising improvements. BP may not maintain its 4.1 million barrels per day for long; it is in talks to sell its 50% stake in Russian venture TNK-BP, which provides a quarter of production.

7. Royal Dutch Shell - 3.9 million barrels per day

Shell is hoping this summer to start drilling for oil in Alaska's Chuckchi Sea. For years since leasing offshore blocks from the federal government Shell has been perfecting its drilling plan and preparing the Kulluk floating drilling rig, pictured here in the Puget Sound by Seattle.

8. Pemex - 3.6 million barrels per day

Production from Mexico's biggest field, Cantarell (pictured) has plunged from 2 million bbl per day to roughly 600,000 now. State-owned Pemex is working to replace that shortfall with other fields. Mexico's incoming President Enrique Pena Nieto has said reforming Pemex to allow foreign investment will be his signature issue.

9. Chevron - 3.5 million barrels per day

Chevron bought Atlas Petroleum in 2010 for $4.3 billion to gain acreage in the Marcellus and Utica shales. With gas prices low, some expect a bigger deal to come.

10. Kuwait Petroleum Corp. - 3.2 million barrels per day

Kuwait's oil company was originally formed in 1934 by what are now Chevron and BP. In 1975 the company was nationalized. Kuwait's fields suffered greatly by fires set by Saddam Hussein's forces in 1990. Kurwait's biggest field, Burgan, continues to be operated by Chevron.

Croatian Center of Renewable Energy Sources (CCRES)


Solar Market Insight Report 2012 Q1


CCRES 

share to you

U.S. Solar Market Insight 2012 Q1

U.S. Solar Market InsightTM is a quarterly publication of the Solar Energy Industries Association (SEIA)® and GTM Research. Each quarter, we survey nearly 200 installers, manufacturers, utilities, and state agencies to collect granular data on photovoltaic (PV) and concentrating solar. These data provide the backbone of this Solar Market InsightTM report, in which we identify and analyze trends in U.S. solar demand, manufacturing, and pricing by state and market segment. We also use this analysis to look forward and forecast demand over the next five years. As the U.S. solar market expands, we hope that Solar Market InsightTM will provide an invaluable decision making tool for installers, suppliers, investors, policymakers and advocates alike.
INTRODUCTION
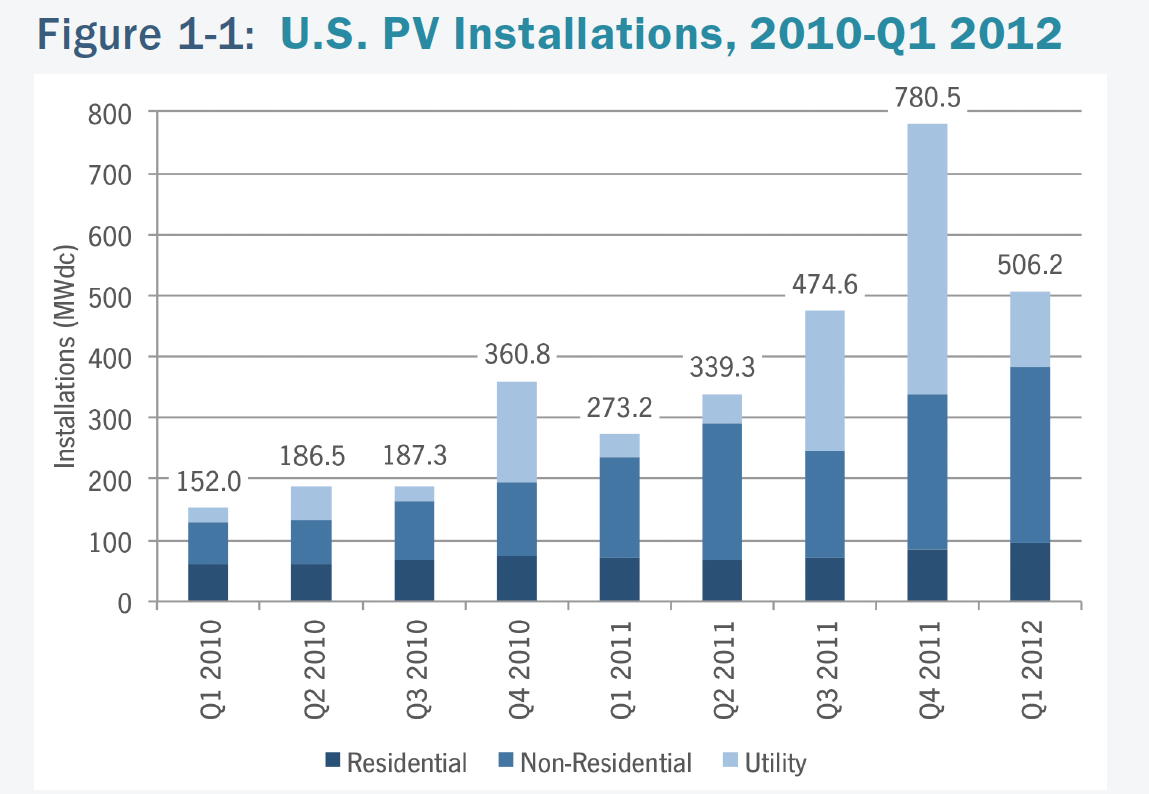
The U.S. began 2012 with the second highest quarter for installations ever. Over 18,000 photovoltaic (PV) systems totaling 506 megawatts (MW) came online in the first three months of the year. This strong showing in the U.S. came amidst turmoil in the global solar industry. Germany and Italy were both locked in discussions to revise their respective feed-in tariff programs. Project developers in both countries rushed to complete installations ahead of tariff reductions, while suppliers benefited from a short-term burst of orders that has lasted into the second quarter.
Marking a shift from an almost exclusive focus on exports, shipments into the Chinese market were at an all-time high, but at such low prices that the market served as little more than a way to allocate otherwise-unsold inventory. Meanwhile, the U.S. maintained its status as a consistently growing, albeit complex, demand center for PV. Despite uncertainty surrounding the availability of project finance, import tariffs, and state-level demand (all of which are discussed in more detail in subsequent sections), the residential and non-residential markets in aggregate grew 35% quarter-over-quarter.

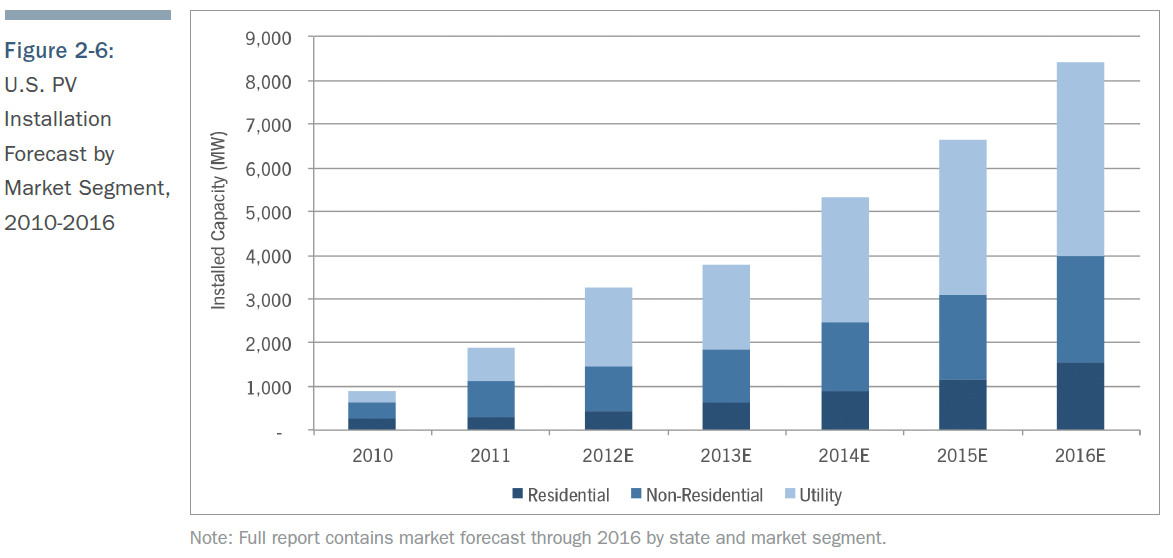
As a result of strong first half demand and shipments in the first half of the year, and accelerated project development timelines for utility-scale projects (discussed in greater detail in Section 2.2), the outlook for 2012 has improved and installations will likely total 3.3 GW. Given GTM Research’s global installation forecast of 29.9 GW, the U.S. market share of global installations will reach nearly 11% in 2012, up from 7% in 2011 and 5% in 2010. This will make the U.S. the fourth-largest global PV market and one of the few major markets (along with China, India and Japan) that can expect continued growth for the foreseeable future.

KEY FINDINGS

Photovoltaics (PV)

• PV Installations in Q1 2012 reached 506 MW, up 85% over Q1 2011
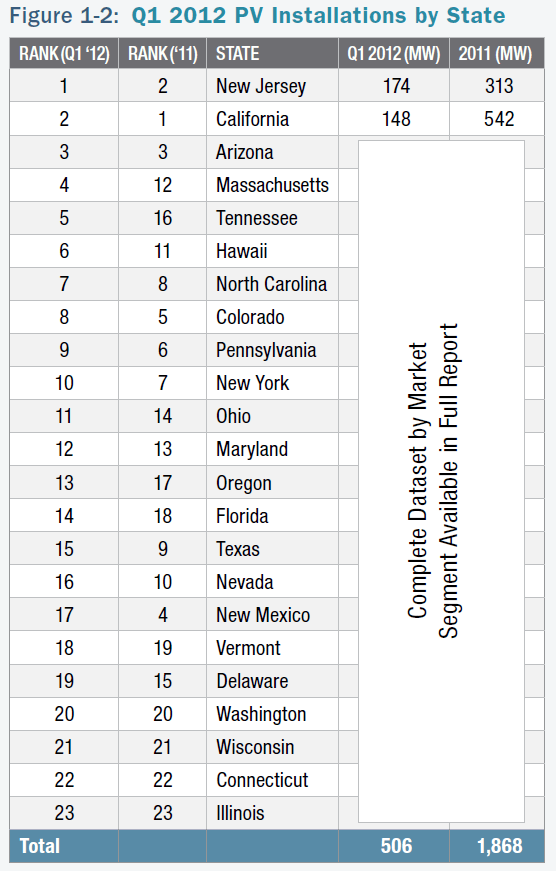
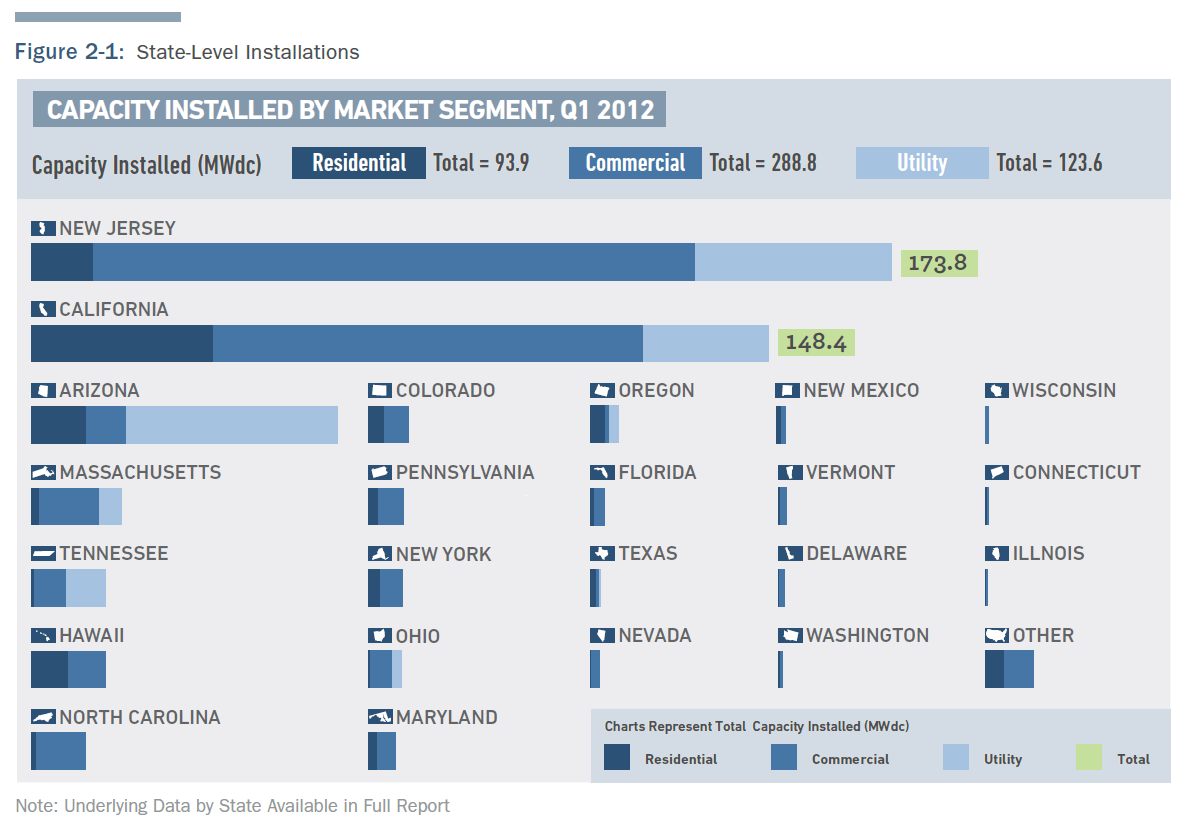
• New Jersey was the largest state market, with 174 MW of installations in Q1 2012
• Pricing for polysilicon and PV components continued to exhibit softness in Q1 2012 due to the persistence of the global oversupply environment that the industry has faced since early 2011. Blended module prices for Q1 2012 were down to $0.94/W, a staggering 47% lower than Q1 2011 levels of $1.78/W
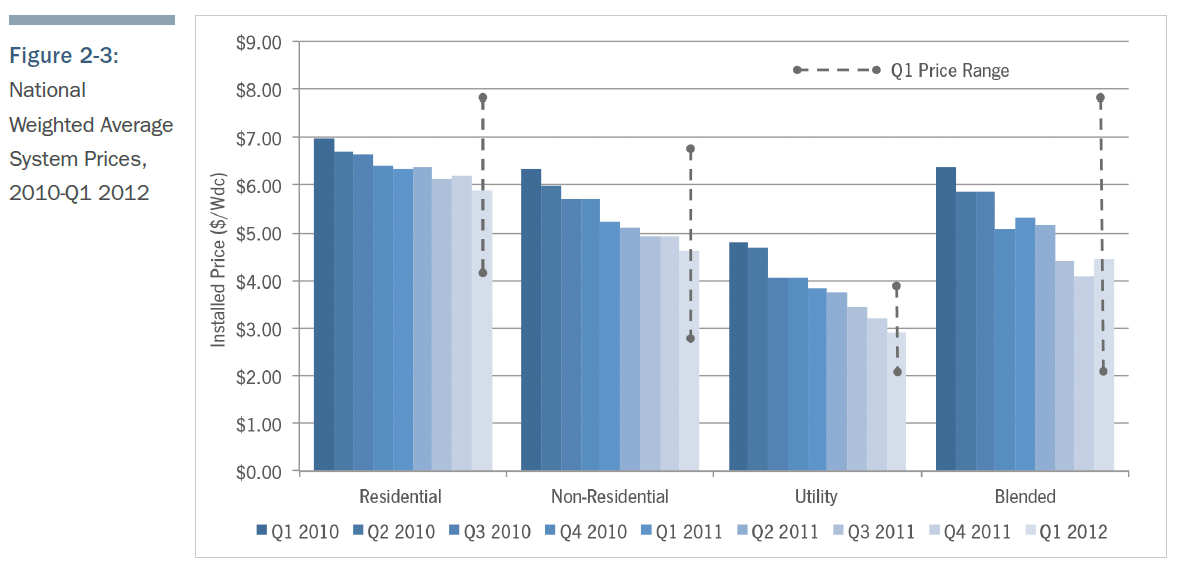
• Installed prices fell in every market segment year-over-year compared to Q1 2011. Residential installed prices fell 7.3 percent, commercial installed prices fell 11.5 percent, and utility prices fell 24.7 percent over Q1 2011. The overall blended average installed price fell 17.2 percent year-over-year
• Cumulative operating PV capacity in the U.S. now totals 4,427 MWdc

Concentrating Solar Power (CSP and CPV)

• Abengoa’s Solana Generating Station received a $125 million investment from Capital Riesgo Global, a subsidiary of Banco Santander, for an equity stake in the project
• Construction of the Power Tower at the Crescent Dunes Solar Energy Project was completed in February 2012
• A total of 1.3 GWac of concentrating solar is now under construction

PHOTOVOLTAICS

Photovoltaics (PV), which convert sunlight directly to electricity, continue to be the largest component of solar market growth in the U.S.

INSTALLATIONS

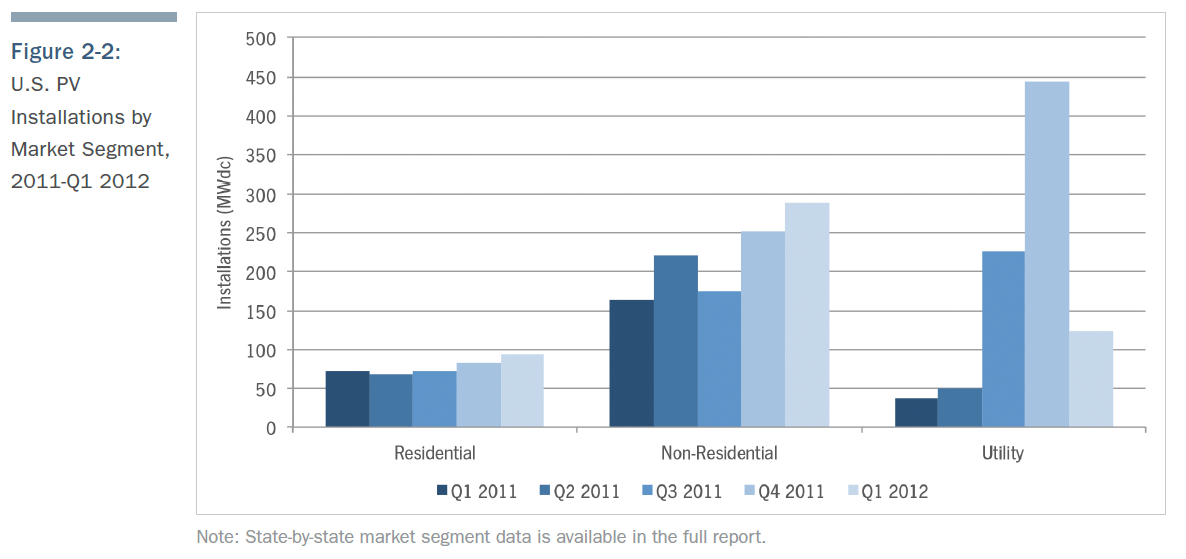
The U.S. installed 506 MW of PV in Q1 2012, up 85% from Q1 2011. While installations were down from the 781 MW installed in Q4 2011, direct comparisons between these two quarters carry little meaning. The utility market accounted for the decline between Q4 2011 and Q1 2012 (443 MW and 124 MW, respectively). Construction timelines for a relatively few large projects can cause large swings from quarter to quarter more than any underlying market dynamics. A total 1.8 GW of utility PV will likely be connected in 2012, more than double the 2011 total, but the vast majority of that capacity will be completed in the second half of the year.

Broadly, three major factors have impacted installation totals in the first quarter of 2012:
1. Seasonality – As noted, the first quarter is generally the smallest in the U.S. market in terms of activity. This is due to adverse weather conditions in the northern part of the country and a seasonal overhang from the rush to complete projects by the end of the previous year. Installation totals will grow throughout the year.
2. Expiration of the Section 1603 Treasury Program and Safe Harbored Products – As we have noted in previous editions of this report series, it was a common strategy at the end of 2011 to ‘safe harbor’ either modules or inverters in order to qualify for the Section 1603 Treasury Program before its expiration. At least 1 GW of modules was safe harbored, and that product is currently being allocated to individual projects.
3. Import Tariff – The pending preliminary decision on the anti-dumping portion of the trade petition filed by SolarWorld created a great deal of uncertainty in the U.S. market in Q1 2012. Anecdotally, a number of Chinese suppliers offered ‘tariff-proof’ modules by being the importer of record and taking on the tariff risk themselves. This is reflected in the Q1 tariff charges that were announced by a number of suppliers in their quarterly earnings following the preliminary determination. Apart from this, developers report having shifted some procurement to non-Chinese producers.

Residential installations grew 12% quarter-over-quarter (Q/Q) and 31% year-over-year (Y/Y). This represents the fourth quarter in a row of steady, incremental increases in residential installations in the U.S. While the residential market remains the smallest segment in terms of volume, it has also shown the least volatility over the past three years. As noted in previous reports, the overarching trend in the residential market is the shift from host-owned systems to third-party ownership through power-purchase agreements (PPA) or lease structures. At least 16 companies offer residential leases/ PPAs, either in their own installations or through partner installers. Many residential integrators now have access to a lease/PPA program of some kind, and customers increasingly select third-party ownership over direct ownership. SolarCity, one of the pioneers of this model, filed to go public in April 2012 and may be among the first pure-play residential solar integrators/financiers to be publicly traded – along with Real Goods Solar, which is currently listed on the NASDAQ.
Non-residential (commercial, government and non-profit) installations grew 14% Q/Q and 77% Y/Y. As was the case throughout 2011, the non-residential market was supported substantially by a rapidly growing New Jersey market (122 MW in Q1 – the first time a single state has installed over 100 MW of non-residential solar in a single quarter). California also had a strong Q1, installing 87 MW. Given the expected downturn in the New Jersey non-residential market and the competitiveness of California, many developers are hoping to find other non-residential growth markets. The full version of this report highlights three states with in which we expect substantial near-term growth prospects in non-residential installations: New York, Massachusetts, and Hawaii.
Utility installations reached 124 MW in Q1 2012 coming from 18 projects.The largest of these projects was the first phase (30 MWac, 34.5 MWdc) of the 290 MWac Agua Caliente project in construction by First Solar. In Q2, another 70 MWac was completed, and the majority of the project is expected to be on-line by the end of 2012. Apart from this, the majority of the utility projects completed in Q1 could be considered wholesale distributed generation, generally defined as a 1MW to 20 MW project connected at the distribution level. This is an increasingly popular tactic with a number of benefits, ranging from fewer land use and permitting issues to easier grid interoperability.

INSTALLED PRICE

Year-over-year, the national capacity-weighted average installed price declined by 17.2 percent to $4.44/W. Q/Q the average system price rose by 8.25 percent. This average number is heavily impacted by the volume of utility-scale installed in a given quarter, and there was substantially less utility-scale solar connected in the first quarter of 2012 compared to the fourth quarter of 2011. It should be noted that prices reported are weighted averages based on all systems that were completed in Q1 in many locations. Average installed price within each market segment fell both quarter-over-quarter and year-over year.

• RESIDENTIAL system prices fell by 4.8 percent from Q4 2011 to Q1 2012, with the national average installed price falling from $6.18/W to $5.89/W. Y/Y, installed costs declined by 7.2 percent. This quarterly decrease is largely a result of price reductions in the major state markets of California and New Jersey, though many secondary markets witnessed price drops as well. With the exception of a few regions which can sustain higher installed costs, engineering, procurement, and construction (EPC) costs in established markets are typically in the mid-$4-per-watt range. With developer margins and financing costs stacked on, average prices climb into the $5 to $6 per watt range. States with solar carve-outs saw a noticeable drop in prices, largely necessitated by the decreasing value of solar renewable energy credits (SRECs).
NON-RESIDENTIAL system prices fell by 6 percent Q/Q, from $4.92/W to $4.63/W. Year-over-year, installed costs declined by 11.4 percent. New Jersey, the largest non-residential state market in Q1, led the low-cost charge as developers worked hard to mitigate plunging SREC prices. The same was seen in DE, MA, and MD, but on a less drastic scale. For projects in excess of a few hundred kilowatts, EPC costs have fallen to the mid-$2-to-$3-per-watt range. Moreover, larger, well established installers increased their competitiveness by buying significant quantities of low-cost modules on the spot market or via short-term supply agreements.
• UTILITY system prices declined for the eighth consecutive quarter in a row, dropping from $3.20/W in Q4 2011 to $2.90/W in Q1 2012. This 9.4 percent quarterly reduction is largely a result of low-cost modules continuing to be available in significant quantities. Y/Y, installed costs declined by 24.7 percent. The four largest projects that came online in the first quarter, all in excess of 10 MW, used an even split of low-cost Chinese-made c-Si or CdTe panels.

COMPONENT MANUFACTURING AND PRICING


Pricing for polysilicon and PV components continued to exhibit softness in Q1 2012 due to the persistence of the global oversupply environment that the industry has faced since early 2011. Blended polysilicon prices declined by 12 percent to $38/kg. Price drops for wafers, cells and modules were steeper at 18 percent quarter-over-quarter. Blended module ASPs for Q1 2012 were down to $0.94/W, a staggering 47 percent lower than Q1 2011 levels of $1.78/W.

MARKET OUTLOOK

Early strength in New Jersey, the large volume of safe-harbored modules combined, and positive industry outlooks for California, Massachusetts, and Hawaii suggest that 2012 will be a stronger year for installations than previously anticipated. As such, total installations could reach 3.3 GW this year. 2013, however is an open question. The impacts of the import tariff on Chinese cells, as well as the expiration of the 1603 Treasury Program, will be felt most next year. This could coincide with the trough of demand in New Jersey and California’s adjustment period into a post-CSI world to create a temporary slow-down of growth in that year. The market should regain its momentum thereafter and continue along its path to become a global PV market leader by 2015.

CONCENTRATING SOLAR

INSTALLATIONS

Q1 2012 saw just one 20 kW concentrating PV (CPV) project completed. There were no concentrating solar power (CSP) projects completed in Q1 2012. While less than 1 MW came on-line in the first quarter, there was additional progress on several of the large concentrating solar projects under development.
Significant developments in Q1 2012 include:
• Abengoa’s Solana Generating Station received a $125 million investment from Capital Riesgo Global, a subsidiary of Banco Santander, for an equity stake in the project.
• Construction of the Power Tower at the Crescent Dunes Solar Energy Project was completed in February 2012.
• SolarReserve’s Saguache Project received its final land use permit from the Saguache County Board of County Commissioners.
• A total of 1.3 GWac of concentrating solar is now under construction

U.S. Solar Market Insight Full Report

Get the latest Strategic Data & Analysis Today!

U.S. Solar Market Insight™ is a collaboration between the Solar Energy Industries Association® (SEIA®) and GTM Research that brings high-quality, solar-specific analysis and forecasts to industry professionals in the form of quarterly and annual reports.
Each quarter, GTM Research gathers a complete account of industry trends in the U.S. photovoltaic (PV) and concentrating solar power (CSP) markets via comprehensive surveys of installers, manufacturers, utilities and state agencies. Annually, we supplement our PV and CSP analysis with coverage of the latest in the solar hot & cooling (SHC) and solar pool heating (SPH) markets. The result is the most relevant industry data and dynamic market analysis available.
The U.S. Solar Market Insight™ Reports are offered in two different versions– the Executive Summary and Full Report. The Full Report is available individually or as part of an annual subscription. Please find a description of each publication below, or click here to see our quarterly report Table of Contents by solar technology.
Figure: 2011 Year-in-Review
Source: GTM Research and SEIA

Executive Summary

Each quarter's Executive Summary provides a general breakdown of the current state of the PV, CPV and CSP markets in the U.S. Executive Summaries feature the following level of analysis and detail:
  • National aggregate capacity additions
  • National weighted average installed price
  • National aggregate number of installations
  • National aggregate manufacturing production

full report contents

The quarterly Full Reports are comprehensive, timely perspectives on the PV, CPV and CSP sectors. These versions are approximately 70 pages in length and include all the data and analysis from our Executive Summary plus incisive, state-level breakdowns of installations, costs, manufacturing and demand projections. The full reports feature the following:
  • Installations by market segment for the top 23 states
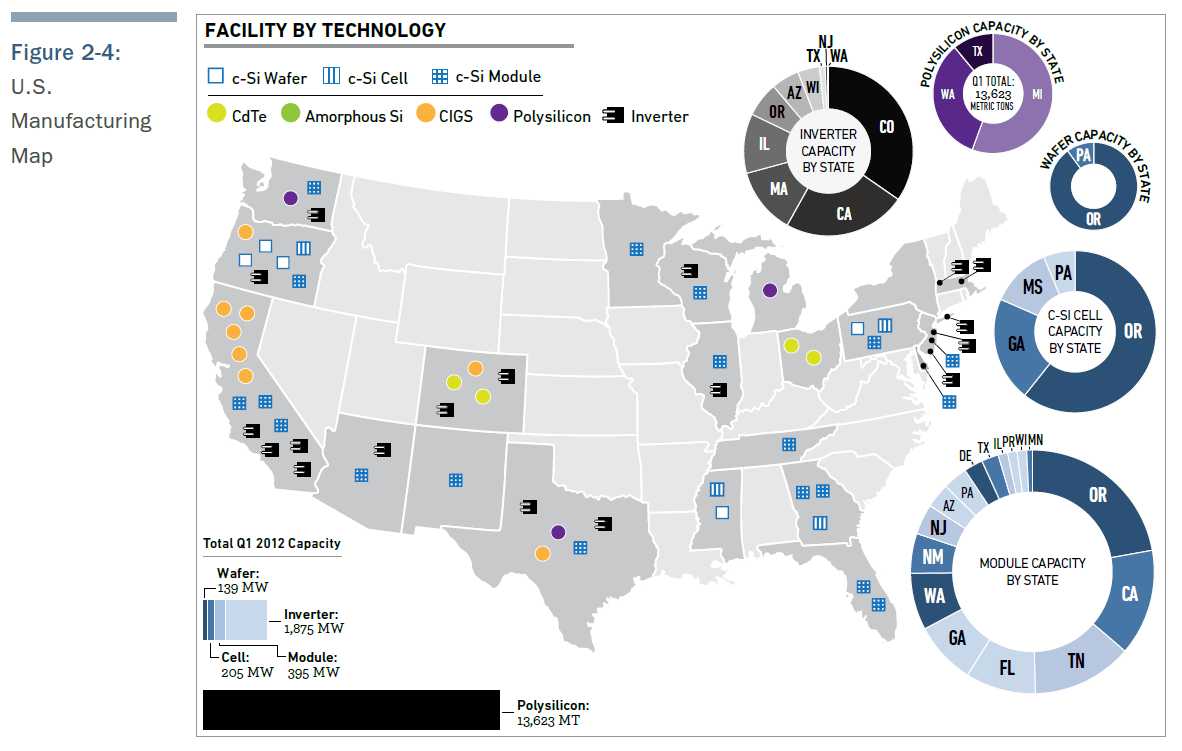
  • Manufacturing capacity & production by component by state
  • Installed cost by market segment for each state
  • Demand projections to 2016 by technology, market segment & state
  • State-by-state strategic market analysis
  • Component pricing across the value chain
Download a free copy of this quarter's Executive Summary today.
Pdf Icondownload
 
  CCRES special tanks to

SEIA

Established in 1974, the Solar Energy Industries Association (SEIA) is the national trade association of the U.S. solar energy industry. Through advocacy and education, SEIA is building a strong solar industry to power America.
As the voice of the industry, SEIA works with its member companies to make solar a mainstream and significant energy source by expanding markets, removing market barriers, strengthening the industry and educating the public on the benefits of solar energy.
SEIA is a 501(c)6 non-profit trade association. Our sister organization, The Solar Foundation, a 501(c)3 non-profit charitable organization, oversees policy-driven research and develops education & outreach programs to promote the further development of solar energy in the U.S.
In January 2012, SEIA merged with the Solar Alliance, an advocacy organization working to establishing solar policies at the state level. The two organizations now operate under the SEIA brand in order to present a unified solar industry voice in all state and federal advocacy efforts.
If your business is involved in solar energy in the U.S., joining SEIA can help give you the tools you need to succeed in a rapidly-changing market, including:
  • Powerful advocacy - SEIA's government affairs staff works with state and federal policymakers to pass pro-solar, market-based policies to help your business grow
  • Comprehensive market research - Along with our partners at GTM Research, we provide information on the full supply-chain for the domestic market through the U.S. Solar Market Insight Report
  • Industry networking - Connect with solar industry veterans and entrepreneurs at our exclusive networking events and B2B trade shows like PV America and Solar Power International, produced with the Solar Electric Power Association (SEPA)
  • Public relations - SEIA works to highlight positive stories about solar energy and promotes industry news to members of the press
Croatian Center of Renewable Energy Sources (CCRES)

Friday, July 20, 2012

Geotermalni izvori - gdje je zapelo ?!

 Geotermalni izvori


Geotermalni izvori

U Hrvatskoj postoji tradicija iskorištavanja geotermalne energije iz prirodnih izvora u medicinske svrhe i za kupanje. Brojne toplice koriste upravo geotermalnu energiju (Varaždinske Toplice, Daruvarske Toplice, Stubičke Toplice, Lipik, Topusko itd.). Proizvodnja geotermalne vode za navedene toplice prije se vršila kroz prirodne izvore, dok se danas uz prirodni protok koristi geotermalna voda iz plitkih bušotina. Ukupno postoji 28 nalazišta, od kojih je 18 u upotrebi.

INA-Naftaplin je 1970-ih godina započela s istraživanjem rezervi nafte i plina na poljima u kontinentalnom dijelu Hrvatske. Istražne bušotine pokazale su postojanje izvora tople vode. Najviše istražena ležišta, a ujedno i ležišta s najvišom temperaturom geotermalnog fluida su ležište u blizini Koprivnice (Kutnjak-Lunjkovec) i Bjelovara (velika Ciglena).

40 godina kasnije nezamisliv i neoprostiv zastoj.

Zašto?

1998. godine Energetski institut “Hrvoje Požar” je pripremio program korištenja geotermalne energije u Hrvatskoj, koji pokazuje da Hrvatska ima nekoliko srednjetemperaturih geotermalnih izvora s relativno niskim temperaturama geotermalne vode u rasponu od 100 do 140°C, pomoću kojih je moguća proizvodnja električne energije, npr. Lunjkovec (125°C), Ferdinandovac (125°C), Babina Greda (125°C) i Rečica (120°C). No, konkretne inicijative za gradnju geotermalnih elektrana pokrenute su tek posljednjih godina. Za proizvodnju električne energije iz srednjetemperaturnih geotermalnih izvora dolaze u obzir elektrane s binarnim ciklusom, bilo s organskim Rankineovim ciklusom (ORC) ili Kalina ciklusom. 

U literaturi se Kalina ciklus navodi kao termodinamički povoljniji ciklus od ORC, tj. koji postiže veću termodinamičku iskoristivost i daje više snage. S druge strane, spoznaje autora objavljene u prethodnim radovima, a predstavljene i na 3. međunarodnom forumu o obnovljivim izvorima energije ovdje u Dubrovniku, dobivene na temelju proračuna za srednjetemperaturni geotermalni izvor u Hrvatskoj (Velika Ciglena) s relativno visokom temperaturom geotermalne vode (175°C) pokazuju suprotno. ORC je termodinamički bolji od Kalina ciklusa. To se objašnjava relativno visokom temperaturom geotermalne vode kao i relativno visokom prosječnom godišnjom temperaturom zraka za hlađenje u kondenzatoru (15°C), koja ima nepovoljniji utjecaj kod Kalina ciklusa nego kod ORC-a. U ovom će se radu usporedba ORC i Kalina ciklusa provesti za srednjetemperaturno geotermalno polje s relativno niskom temperaturom geotermalne vode (125°C) i ponovo uz relativno visoku prosječnu godišnju temperaturu zraka za hlađenje u kondenzatoru (15°C): konkretno za geotermalno polje Lunjkovec. Usporedba ORC i Kalina ciklusa će se provesti na temelju rezultata energetske i eksergetske analize.

 Konačni cilj usporedbe je predložiti povoljnije binarno postrojenje, bilo s ORC ili Kalina ciklusom, za srednjetemperaturne geotermalne izvore u Hrvatskoj s relativno niskim temperaturama geotermalne vode.

14  godina kasnije nezamisliv i neoprostiv zastoj.


Zašto?

Geotermalna energija je toplinska energija koja se stvara u Zemljinoj kori polaganim raspadanjem radioaktivnih elemenata, kemijskim reakcijama, kristalizacijom i skrućivanjem rastopljenih materijala ili trenjem pri kretanju tektonskih masa. Količina takve energije je tako velika da se može smatrati skoro neiscrpnom.
Iskorištavanje geotermalne energije podrazumijeva iskorištavanje energije nagomilane u unutrašnjosti Zemlje u obliku vruće vode i pare ili u suhim stijenama. Pri tome je bitna razlika temperatura između površine i unutrašnjosti Zemlje. Temperaturni gradijent, odnosno povećanje temperature po kilometru dubine, najveći je neposredno uz površinu, a s povećanjem udaljenosti od površine postaje sve manji.
Za praktično iskorištavanje geotermalne energije potrebno je iskoristiti prirodno strujanje vode ili stvoriti uvjete za takvo strujanje. Osnovno načelo je da se voda dovodi s površine Zemlje u dublje slojeve, u njima se ugrije preuzimajući toplinu nagomilanu u Zemljinoj unutrašnjosti i tako ugrijana ponovno pojavljuje na površini.
U većim dubinama Zemljine kore nalaze se velike mase suhih stijena koje sadrže znatne količine energije. Voda s površine ne može prodrijeti u te stijene prirodnim putem. Da bi se ta energija iskoristila, potrebno je duboko ispod površine razdrobiti suho stijenje kako bi se dobila dovoljno velika površina za prelazak topline sa stijena na vodu. Pritom bi se voda s površine dovodila među raspucalo stijenje umjetno stvorenom bušotinom, a ugrijana voda odvodila drugom bušotinom na površinu. Još uvijek nije tehnološki razrađeno komercijalno isplativo iskorištavanje energije suhih stijena, niti vruće vode koja se nalazi u vrlo velikim dubinama.
Danas se geotermalna energija koristi u mnogim zemljama u sljedeće svrhe:
  • za potrebe liječenja i rekreacije,
  • za potrebe grijanja i tople vode,
  • za proizvodnju električne energije,
  • za potrebe poljoprivrede (primjerice. zagrijavanje staklenika, ribnjaka, zemljišta),
  • za potrebe industrije.

Hrvatski geološki institut


Croatian Geological Survey


Hrvatski geološki institut najveći je istraživački institut u području geoznanosti i geološkog inženjerstva u Republici Hrvatskoj. Geološki podaci predstavljaju temelj za rješavanje mnogih projekata od nacionalnog značaja kao što su opskrba pitkom vodom, zaštita voda i tala, izgradnja prometne infrastrukture, urbanističko planiranje, definiranje rezervi mineralnih sirovina i zaštite okoliša.
U istraživanjima se koriste najsuvremenije metodologije kao i informacijske i računalne thgiehnologije. U institutu je aktivno 66 znanstvenika i istraživača i 12 znanstvenih novaka na realizaciji Programa temeljne djelatnosti (Geološke karte), pitanjima zaštite okoliša, istraživanju podzemnih voda, inženjerskogeoloških karakteristika terena te istraživanju mineralnih sirovina.
Hrvatski geološki institut surađuje s mnogim srodnim institucijama, organizacijama i fakultetima u zemlji, a kao takav prepoznat je i u međunarodnoj akademskoj zajednici o čemu svjedoče mnogi međunarodni istraživački projekti koji se izvode u Institutu.


Energetski potencijal u Republici Hrvatskoj

Geotermalni gradijent

Dva sedimentna bazena pokrivaju gotovo cijelo područje Republike Hrvatske: Panonski bazen i Dinaridi. Velike su razlike u geotermalnim potencijalima koji su istraženi istražnim radovima u svrhu pronalaska nafte i plina.
U Dinaridima prosječni geotermalni gradijent i toplinski tijek iznosi:
G=0,018 °C/m
q=29 mW/m2


Na ovom području se ne mogu očekivati otkrića značajnijih geotermalnih ležišta. Moguća su otkrića voda sa temperaturama na površini prikladnim za rekreativne i balneološke namjene. Vode takvih karakteristika su otkrivene u Istarskim Toplicama, Splitu, Omišu, Sinju i Dubrovniku.
Za razliku od Dinarida, koji nemaju značajnih geotermalnih potencijala u Panonskom bazenu prosječni geotermalni gradijent i toplinski tijek su mnogo viši:
G=0,049 °C/m
q=76 mW/m2

Budući da je geotermalni gradijent na panonskom području znatno veći od europskog prosjeka na ovom području se može očekivati, pored već otkrivenih geotermalnih ležišta, pronalaženje novih geotermalnih ležišta.

Geotermalni potencijal

Ukupni toplinski geotermalni energetski potencijal iz sve tri skupine iznosi MWt:
do 50°C do 25°C
Iz već izrađenih bušotina:
203,47 319,21
Uz potpunu razradu ležišta:
839,14 1169,97
Geotermalne potencijale u Hrvatskoj možemo podijeliti u tri skupine – srednje temperaturne rezervoare 100 – 200 °C, niskotempraturne rezervoare 65 do 100°C i geotermalne izvore temperature vode ispod 65 °C.

Srednjetemperaturni geotermalni potencijali

Geotermalna energija iz ovih ležišta može se iskorištavati za grijanje prostora, u različitim tehnološkim procesima te za proizvodnju električne energije binarnim procesom.
Područje
Bjelovar
Bjelovar
Ludbreg
Đurđevac
Karlovac
Županja
Lokacija (ležište)
Velika
Ciglena
Velika
Ciglena
Lunjkovec
Ferdinan-
dovac
Rečica
Babina
Greda

Kategorija rezervi
Dokazane
Vjerojatne
Vjerojatne
Vjerojatne
Vjerojatne
Vjerojatne


Dokazane


Dubina bušotina,  m
2800
2800
2500
2500
2500
2500
Način pridobivanja vode
samoizljev
samoizljev
samoizljev
samoizljev
crpka
samoizljev
Izdašnost elementa razrade,  m3/s
0,11566
0,347
0,156
0,1
0,1
0,2
Temperatura vode, °C
170
170
125
125
120
125
Broj bušotina na elementu; (proizvodne + utisne)
2 (1+1)
5 (3+2)
3 (2+1)
3 (2+1)
3 (2+1)
2 (1+1)
Mogući broj elemenata razrade
1
1
10
1
1
1
Broj izrađenih/aktivnih bušotina
2/0
2/0
3/0
1/0
1/0
1/0
Tablica 1. Ležišta s geotermalnom vodom toplijom od 100°C
Ukupna toplinska snaga geoterlmalne energije iz ovih ležišta iznosila bi MWt:
do 50°C do 25°C
Iz već izrađenih bušotina:
168,74 218,07
Uz potpunu razradu ležišta:
755,79 986,64
Moguća snaga proizvedene električne energije iz ovih ležišta iznosila bi (capacity factor 0,9):
Iz već izrađenih bušotina:
10,95 MWe
Uz potpunu razradu ležišta:
47,88 MWe
Neki važniji pokazatelji značajnijih polja:
Lunjkovac – Kutnjak
Na polju Lunjkovec-Kutnjak, geotermalno ležište je ispitano s dvije istražne (naftne) bušotine. Geotermalna voda sadrži 5 g/l otopljenih minerala i 3 m3/m3 plina (85 % CO2, oko 15 % ugljikovodika i tragove H2S). Kamenac se počinje taložiti pri uvjetima tlaka nižeg od 10 bar. Ležišna stijena je karbonatna breča s prosječnom poroznošću od 7,5 %. Procijenjeni volumen pora je oko 109 m3, a područje ležišta oko 100 km2. Temperatura ležišta varira u ovisnosti o dubini vrha ležišta. U nepropusnim stijenama, između ležišta i površine temperaturni gradijent je viši od 0,06 °C/m.
Izdašnost bušotina je 58 l/s s temperaturom od 120 do 130 °C. Na ovom ležištu moguće je pretvoriti geotermalnu energiju u električnu pomoću binarnog ciklusa.

Velika Ciglena
Na dubini od 2500 m u vrlo propusnim stijenama otkrivena je 1990. godine termalna voda visoke temperature (172 °C). Temperaturni gradijent iznosi 0,062 °C/m. Geotermalna voda sadrži 24 g/l otopljenih minerala, 30 m3/m3 CO2 i 59 ppm H2S. Kamenac se počinje taložiti pri uvjetima tlaka nižeg od 20 bar. Iz dvije postojeće bušotine moguće je proizvoditi 115 l/s geotermalne vode.


Niskotemperaturni geotermalni potencijali

Geotermalna energija iz ovih ležišta može se iskorištavati za grijanje prostora te u različitim tehnološkim procesima. U ovom pregledu izneseni su podaci o geotermalnim ležištima i bušotinama s temperaturom vode većom od 65 °C i značajnijim izdašnostima. U tablici 2 izneseni su osnovni tehnički i energetski pokazatelji ovih ležišta. Iz geotermalnih ležišta koja su označena kosim slovima proizvodi se geotermalna voda i iskorištava u energetske svrhe za grijanje prostora, tople sanitarne vode te za rekreaciju.
Ukupna toplinska snaga geotermalne energije iz ovih ležišta iznosila bi (računano do 50°C):
Ukupna toplinska snaga geoterlmalne energije iz ovih ležišta iznosila bi MWt:
do 50°C do 25°C
Iz već izrađenih bušotina:
25,81
47,67
Uz potpunu razradu ležišta:
74,42
129,86

Područje
Zagreb
Valpovo
Osijek
Samobor
Lokacija (ležište)
Mladost
Sveuč.bolnica
Bizovac -TG
Bizovac -PP
Madrinci
Ernesti -novo
SvetaNedelja
Kategorija rezervi
Dokazane
Dokazane
Dokazane
Dokazane
Vjerojatne
Vjerojatne
Vjerojatne


Vjerojatne


Dubina bušotina,  m
1300
1300
1800
1800
1900
1700
1400
Način pridobivanja vode
samoizljev
samoizljev
samoizljev
crpka
samoizljev
crpka
samoizljev
Izdašnost elementa razrade,  m3/s
0,05
0,055
0,003
0,046
0,01
0,046
0,09
Temperatura vode,  °C
80
80
96
90
96
80
68
Broj bušotina na elementu; (proizvodne + utisne)
3 (1+2)
4 (2+2)
2 (1+1)
3 (2+1)
2 (1+1)
3 (2+1)
3 (2+1)
Mogući broj elemenata razrade
1
1
1
6
1
1
1
Broj izrađenih/aktivnih bušotina
3/3
4/1
2/2
1/1
1/0
1/0
1/0
Tablica 2. Ležišta s geotermalnom vodom temperature manje od 100°C
Neki važniji pokazatelji značajnijih polja:

Bizovac
Geotermalna voda se proizvodi iz dva rezervara Biz-gnajs i Biz-pješčenjak i sadrži određene količine otopljenih minerala i ugljikovodičnih plinova. Voda se koristi za grijanje hotela i bazenske vode, a plin u hotelskoj kuhinji. Do sada se otpadna voda ispuštala u lokalne vodotoke, a projekt separacije i reinjekcije otpadnih voda je u pripremi. Voda će se utiskivati u rezervar Biz-gnajs u kojem se ležišni tlak (30 bara iznad hidrostatskog) smanjuje velikom brzinom. Ležišni tlak u rezervaru Biz-pješčenjak smanjuje se vrlo sporo. Taloženje kamenca se pojavilo u gornjem dijelu proizvodnog niza i u površinskim instalacijama. Protiv njih se uspješno primjenjuju inhibitori.

Zagreb
U Zagrebu je naftnom istražnom bušotinom pronađen velik vapnenački vodonosnik, ali njegova propusnost u največem dijelu nije dovoljna za proizvodnju geotermalne vode.
Dio ležišta s dva područja visoke propusnosti nalazi se u jugozapadnom dijelu grada: Blato i Mladost. Na području Blato nalazi se Sveučilišna bolnica, koja je još u izgradnji. Planirana toplinska snaga bušotina na području Blato je 7 MWt, koja će uz korištenje toplinskih pumpi biti veća.
Na Mladosti se nalazi nekoliko većih objekata, koji sve svoje toplinske potrebe zadovoljavaju iz geotermalnih bušotina. Nema tehničkih problema pri eksploataciji navedenog ležišta. Geotermalna voda protječe u zatvorenom sustavu cjevovoda i utiskuje se u utisnu bušotinu, bez otpadnih nusproizvoda i dodira sa zrakom. Instalirana termalna snaga na Mladosti je 6,3 MWt (direktno korištenje).

Geotermalni izvori temperature manje od 65°C

U ovu skupinu izvora pripadaju geotermalni izvori koji se koriste za balneološke i rekreativne svrhe u većem broju toplica i rekreacionih kompleksa. To su izvori Daruvar (Daruvarske Toplice), Ivanić Grad (bolnica Naftalan), Krapinske Toplice, Lipik (Lipičke toplice), Livade (Istarske toplice), Samobor (Šmidhen SRC), Stubičke Toplice, Sveta Jana (Sveta Jana RC), Topusko (toplice Topusko), Tuhelj (Tuheljske toplice), Varaždinske Toplice, Velika (Toplice RC), Zagreb (INA-Consulting), Zelina (Zelina RC), Zlatar (Sutinske toplice).
Ukupna toplinska snaga geoterlmalne energije iz ovih ležišta iznosila bi MWt:
do 50°C do 25°C
Iz već izrađenih bušotina:
8,92
53,47
Uz potpunu razradu ležišta:
8,92
53,47 
Hrvatski Centar Obnovljivih Izvora Energije (HCOIE)