
Forecast Overview
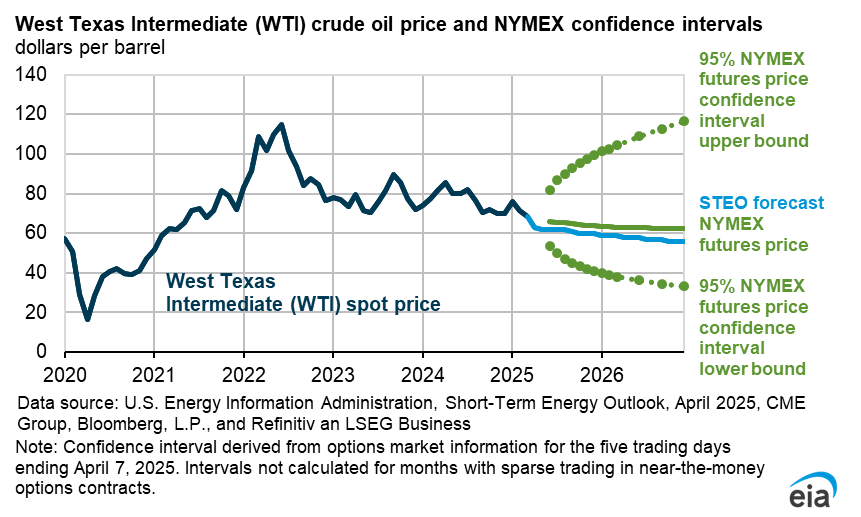
- Global oil supply. We forecast global liquid fuels production will increase by 1.0 million barrels per day (b/d) in 2024. Ongoing OPEC+ production cuts will offset production growth from non-OPEC countries and help maintain a relatively balanced global oil market next year. Although the conflict between Israel and Hamas has not affected the physical oil supply at this point, uncertainties surrounding the conflict and other global oil supply conditions could put upward pressure on crude oil prices in the coming months. We forecast the Brent crude oil price will increase from an average of $90 per barrel (b) in the fourth quarter of 2023 to an average of $93/b in 2024.
- U.S. gasoline consumption. U.S. gasoline consumption declined by 1% in 2024 in our forecast, which would result in the lowest per capita gasoline consumption in two decades. An increase in remote work in the United States, improvements in the fuel efficiency of the U.S. vehicle fleet, high gasoline prices, and persistently high inflation have reduced per capita gasoline demand.
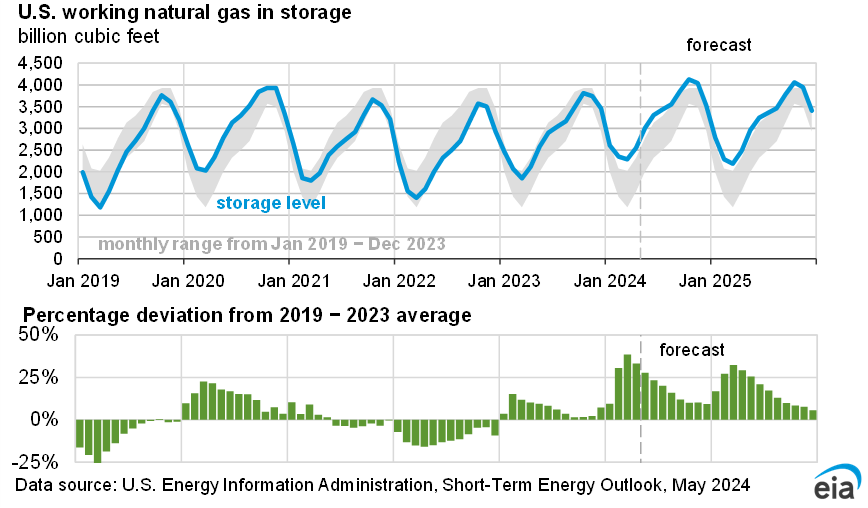
- Natural gas inventories. We estimate that U.S. natural gas inventories totaled 3,835 billion cubic (Bcf) feet at the end of October, 6% more than the five-year (2018–2022) average. We forecast U.S. natural gas inventories will end the winter heating season (November–March) 21% above the five-year average with almost 2,000 Bcf in storage. Inventories are full because of high natural gas production and warmer-than-average winter weather, which reduces demand for space heating in the commercial and residential sectors. We forecast the Henry Hub spot price to average near $3.20 per million British thermal units (MMBtu) in November, down from a price of almost $5.50/MMBtu a year earlier.
- Coal markets. U.S. coal exports have returned to pre-pandemic levels, driven by record-high global coal demand stemming primarily from Europe and Asia. We forecast that exports will rise to 97 million short tons (MMst) in 2023, because of increases in both steam and metallurgical coal exports. We expect steam coal exports to rise by 6 MMst compared with 2022 to 45 MMst in 2023 and metallurgical coal exports to increase by 6 MMst to reach 52 MMst over the same period. Despite this increase in coal exports, we expect U.S. production to fall by more than 100 MMst in 2024 due to reduced demand from the electric power sector. The decline in electricity generation from coal will be offset by an increase in electricity generation from renewable resources.
- OPEC production capacity. Despite rising OPEC spare production capacity in 2023 and in 2024, we lowered our estimate of Iraq’s spare capacity by about 0.4 million b/d compared with last month’s STEO. We removed Iraq’s total production capacity assets in northern Iraq that relied on the northern Iraq-to-Türkiye pipeline for access to global markets. The pipeline has been out of commission since March 2023.
| Notable Forecast Changes | 2023 | 2024 |
|---|---|---|
The current STEO forecast was released on November 7. | ||
| OPEC surplus crude oil production capacity (current forecast) (million barrels per day) | 3.7 | 4.3 |
| Previous forecast | 4.1 | 4.9 |
| Percentage change | -10.0% | -12.0% |
| U.S. coal power demand (current forecast) (million short tons) | 384 | 356 |
| Previous forecast | 473 | 342 |
| Percentage change | 3.1% | 4.0% |
| U.S. coal production (current forecast) (million short tons) | 585 | 480 |
| Previous forecast | 581 | 465 |
| Percentage change | 0.7% | 3.2% |
You can find more information in the detailed table of forecast changes.
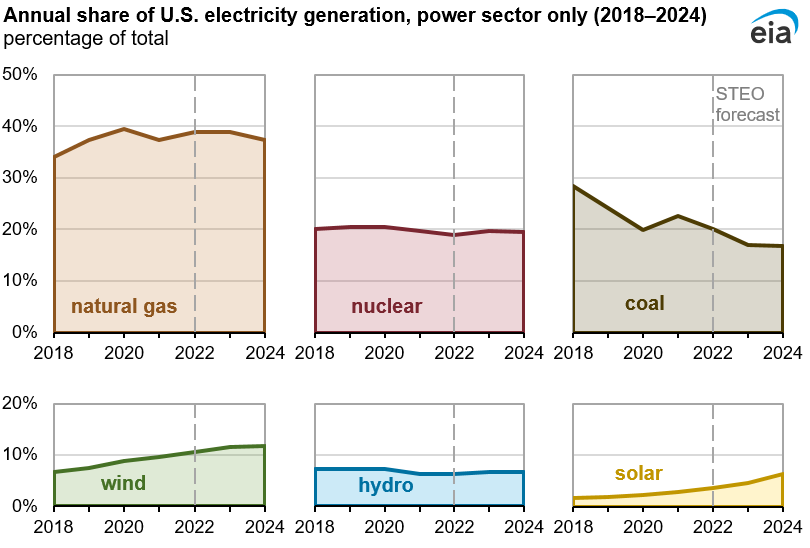
Data values: U.S. electricity generation
Note: The six energy sources shown accounted for at least 98% of annual electricity generation from the electric power sector during this time period.
We expect that new renewables capacity—mostly wind and solar—will reduce electricity generation from both coal-fired and natural gas-fired power plants in 2023 and 2024. Renewable generation capacity additions in our STEO are less uncertain than other forecasts because we survey this information monthly. However, the electricity actually generated from both renewable and nonrenewable sources varies based on weather conditions and market dynamics. It’s this aspect of our STEO electricity generation forecast where most of the uncertainty lies.
Wind and solar accounted for 14% of U.S. electricity generation in 2022. In our February Short-Term Energy Outlook, we forecast that wind and solar will rise slightly, accounting for 16% of total generation in 2023 and 18% in 2024. Electricity generation from coal falls from 20% in 2022 to 17% in both 2023 and 2024. Natural gas accounted for 39% of electric power sector electricity generation last year, and we forecast its share to be similar in 2023 and then fall to 37% in 2024.
Electricity generation from renewable energy sources has been growing steadily in the United States over the past decade. Last year, electric power generation from all types of renewables accounted for nearly one-quarter of total generation by the U.S. electric power sector.
Renewables' output tends to follow capacity additions
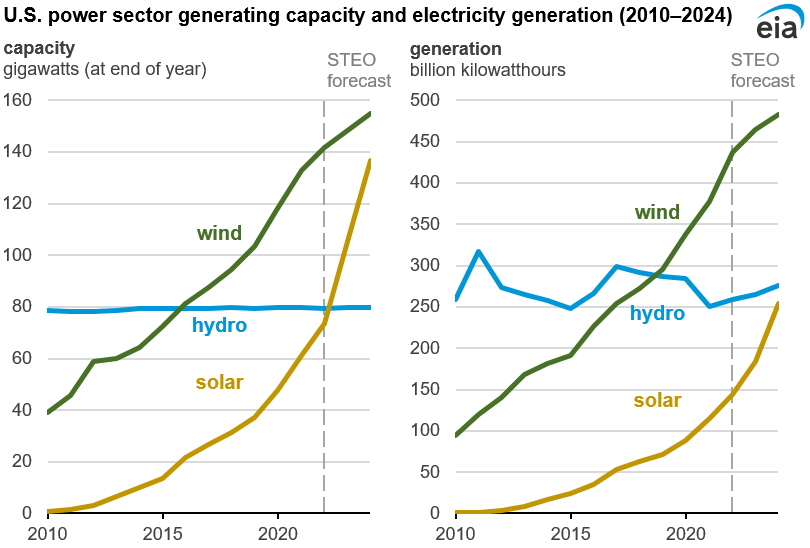
Data values: U.S. generating capacity, U.S. electricity generation
The increase in renewables generation is being driven primarily by investment in new solar and wind generating capacity. The U.S. electric power sector operated about 73 gigawatts (GW) of solar photovoltaic (PV) capacity at the end of 2022. Power generators are reporting plans to expand solar capacity by 43% (32 GW) in 2023, which would be the largest percentage increase in solar capacity since 2016. Solar capacity will increase an additional 30% (31 GW) in 2024.
We expect U.S. wind capacity to increase 5% in each of the next two years, 6 GW in 2023 and 7 GW in 2024. Many solar and wind projects tend to come online in December, so these capacity additions tend to have the most impact on generation in the following year.
We compile information about existing and future capacity on our Preliminary Monthly Electric Generator Inventory, which is based on our monthly survey. When companies report plans for future capacity on these surveys, the projects are generally already in the development process. Although projects may experience delays, the majority of projects reported as future builds eventually come online.
We forecast coal generation to decline this year because the power sector is starting out in 2023 with about 5% (11 GW) less coal-fired capacity than at the beginning of 2022. U.S. natural gas-fired capacity rose by 3 GW over the past year, but that represents a less than 1% increase. Unlike electricity generation from renewable sources, generation from natural gas and coal are more affected by relative fuel costs.
Sources of uncertainty: weather and fuel costs
Two leading factors that make our electricity forecasts especially uncertain are future weather and fuel costs. Our forecast uses temperature outlooks from the National Oceanic and Atmospheric Administration. Temperatures directly affect overall electricity demand.
Electricity demand typically peaks in the summer when homes and businesses use air conditioning. Over the last 10 years, July 2020 saw the most monthly population-weighted U.S. cooling degree days at 397 cooling degree days; the most heating degree days were in January 2014, at 971 heating degree days. Electricity demand increases less during winter months because about 40% of U.S. households use electricity for their primary space heating needs.
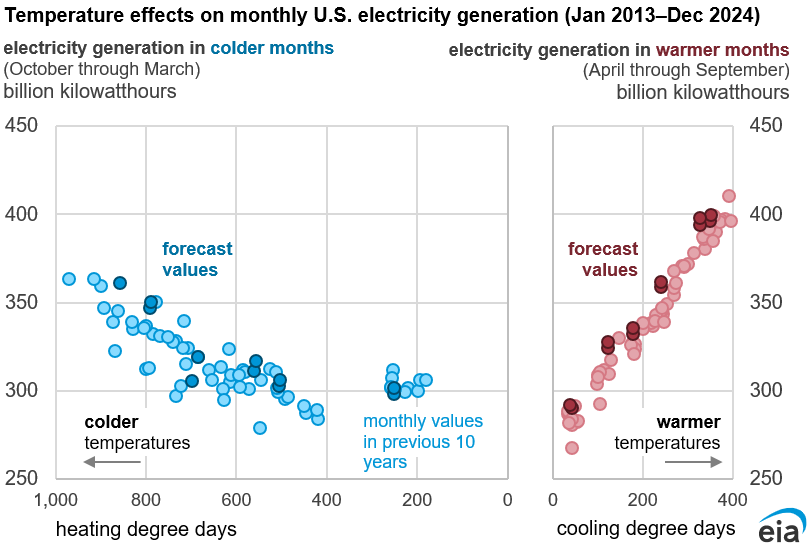
Data values: U.S. electricity generation, Weather data
Variability in weather also leads to uncertainty in renewable generation. Our forecast assumes historically typical operating conditions for wind and solar, but weather conditions can cause output from both sources to vary significantly. Similarly, variations in precipitation can lead to uncertainty in hydropower generation. In 2021, California’s drought caused the state’s hydropower output to fall 48% below the previous 10-year average. More recently, precipitation along the West Coast increased snowpack, which will likely lead to higher-than-normal hydroelectric generation in California this year.
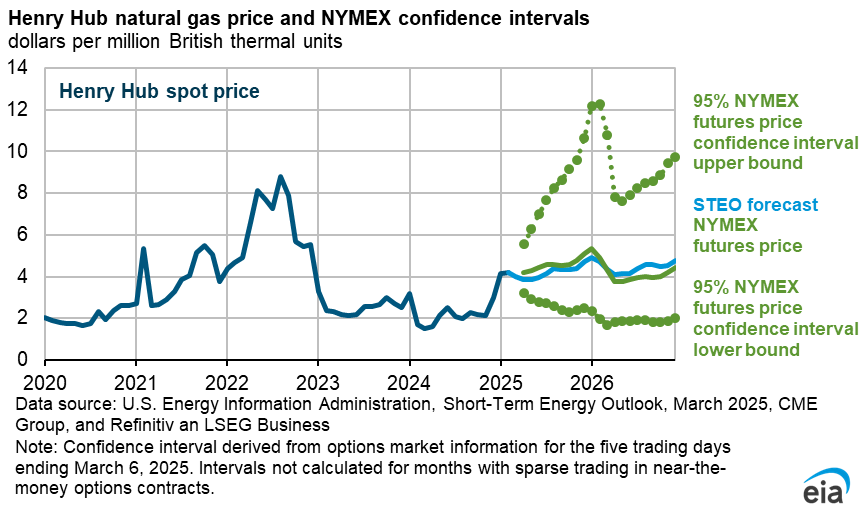
Natural gas prices are one of the primary factors that determine generation levels from existing coal and natural gas-fired power plants. Natural gas prices have also been one of the most uncertain aspects of the STEO forecast. In the past two months, the daily spot price of Henry Hub natural gas ranged from $7.20 per million British thermal units (MMBtu) in mid-December to $2.65/MMBtu at the end of January.
In our current outlook, we forecast the Henry Hub price to rise slightly throughout 2023, from $3.05/MMBtu in February to $4.11/MMBtu in December. However, if natural gas prices are higher than we expect, natural gas-fired generation could decline and coal generation could remain relatively flat.
The U.S. Energy Information Administration (EIA) collects, analyzes, and disseminates independent and impartial energy information to promote sound policymaking, efficient markets, and public understanding of energy and its interaction with the economy and the environment.
The U.S. Energy Information Administration is committed to its free and open data by making it available through an Application Programming Interface (API) and its open data tools. EIA's API is multi-faceted and contains the following time-series data sets organized by the main energy categories.
U.S. Energy Information Administration
1000 Independence Ave., SW
Washington, DC 20585
No comments:
Post a Comment